Display Sensor Data
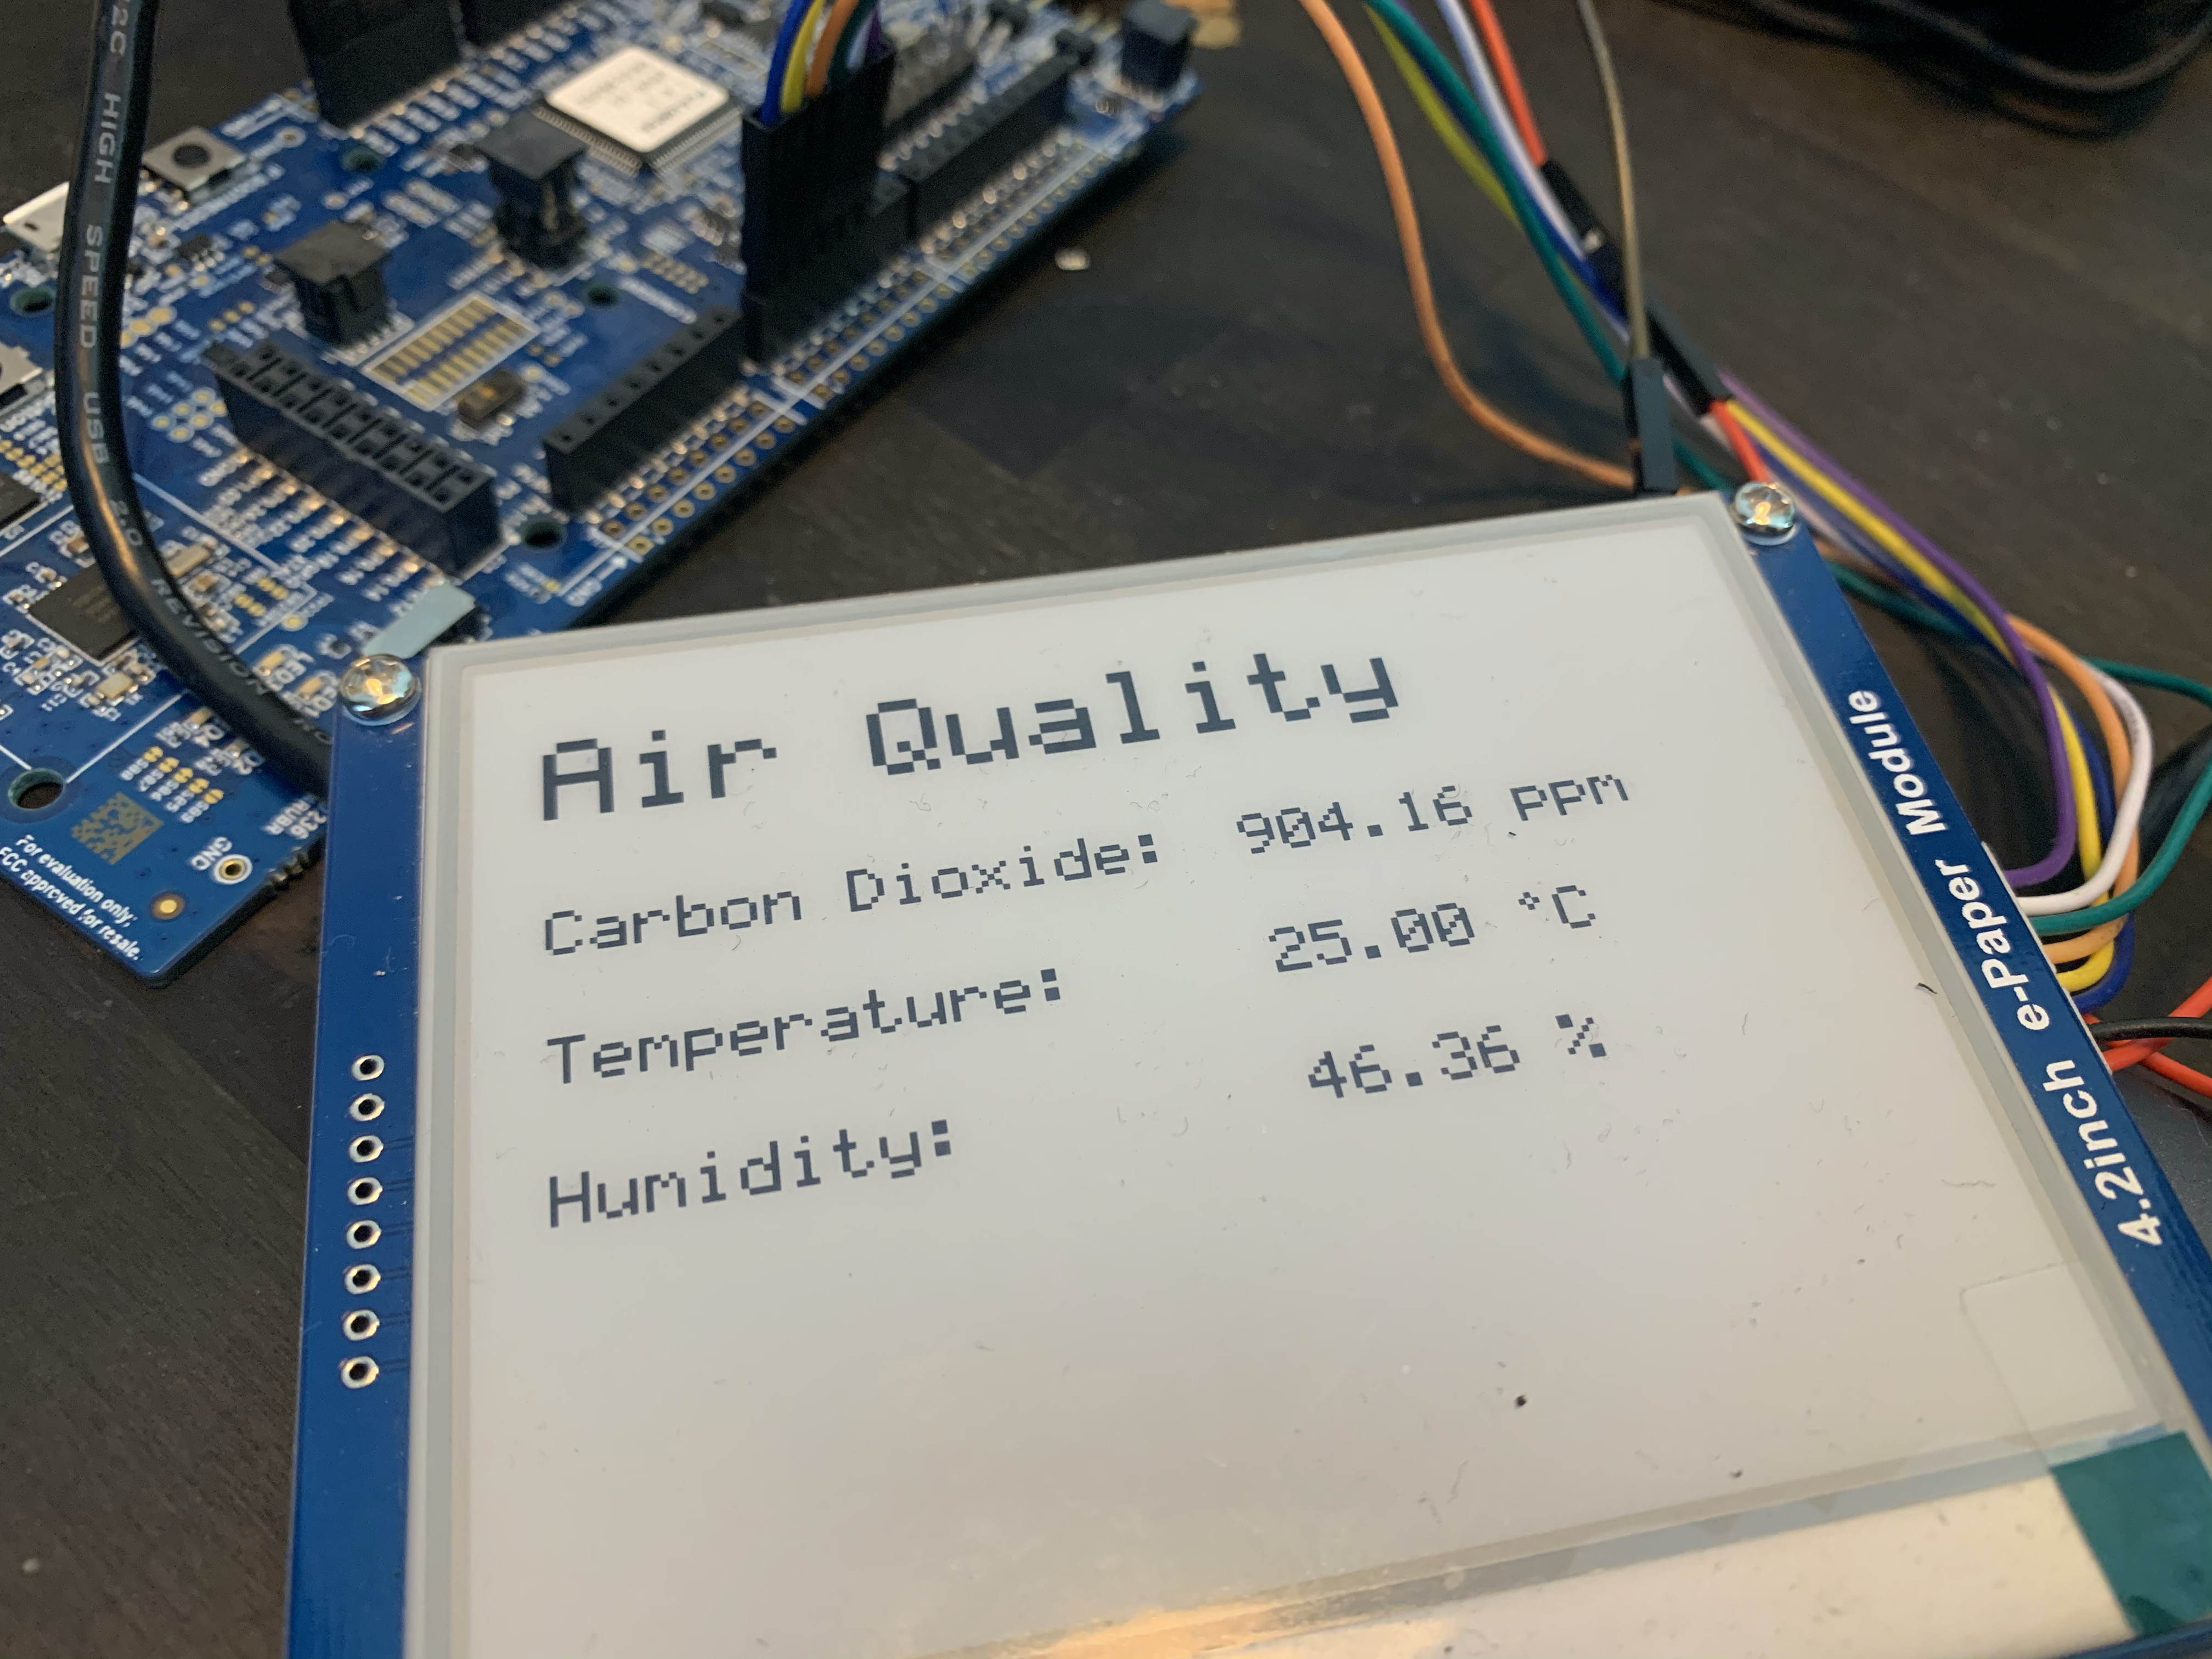
In this section, we're going to display the sensor data on the ePaper display. The display will show a title, "Air Quality" in a bigger font, underneath are the figures, their values and their units in a smaller font.
We're going to implement this feature, starting from 12_scd_30_alert.rs.
Wiring
✅ Reconnect the breadboard's + wire to VDD and the - wire to GND on the development board.
✅ Connect all other cables to their respective pins on the the development board.
✅ The ePaper Display needs its own power source to get enough current. Connect it to the other VDD and GND.

Instantiate SPIM
This is a repetition of last chapter. Try it on your own, and see how much you have learned! If you don't remember how, go back to the last chapter.
✅ Run your code, to make sure everything builds. Nothing new should show up on your display.
Displaying Static Text
✅ Add a new module display_helper.
✅ Inside display_helper/mod.rs bring the following resources into scope:
#![allow(unused)]
fn main() {
use epd_waveshare::{
    epd4in2::*,
};
use embedded_graphics::{
    egtext,
    fonts::{Font12x16, Font24x32, Text},
    geometry::Point,
    pixelcolor::BinaryColor,
    prelude::*,
    style::TextStyle,
    text_style,
};
}
The first step is to write the text that remains static, such as the title and the name of the figure displayed. The function takes Display4in2 the display type as mutable argument, and returns it.
Basic text with built-in fonts are added in a similar way as basic shapes. To place it on the display, you need:
- a String
- the top left coordinate of where the text starts
In our case we have the choice between 6 sizes of a simple bitmap font and color on or off for style. The font for the title is bigger than the font for the rest of the text.
✅ Add the following function to your module.
#![allow(unused)]
fn main() {
pub fn draw_text (mut display: Display4in2 ) -> Display4in2 {
    Text::new("Air Quality", Point::new(20, 30))
        .into_styled(TextStyle::new(Font24x32, BinaryColor::On))
        .draw(&mut display).unwrap();

    Text::new("Carbon Dioxide:", Point::new(20, 90))
        .into_styled(TextStyle::new(Font12x16, BinaryColor::On))
        .draw(&mut display).unwrap();

    Text::new("Temperature:", Point::new(20, 130))
        .into_styled(TextStyle::new(Font12x16, BinaryColor::On))
        .draw(&mut display).unwrap();

    Text::new("Humidity:", Point::new(20, 170))
        .into_styled(TextStyle::new(Font12x16, BinaryColor::On))
        .draw(&mut display).unwrap();

    display
}
}
✅ Go to your main file.
✅ Inside the measuring loop add an instance of the display, followed by a call to fn draw_text.
#![allow(unused)]
fn main() {
let display = Display4in2::default();

let display = display::draw_text(display);
}
✅ In order for the display to actually show what has been written to its buffer, add the following lines to update and display the frame.
#![allow(unused)]
fn main() {
epd4in2.update_frame(&mut spi, &display.buffer()).unwrap();
epd4in2.display_frame(&mut spi).expect("display frame new graphics");
}
✅ Run the your program. You should see the title followed by 3 lines of text.
Displaying Dynamic Text
While static text is rather simple, displaying values that we expect to change while the program is running using format strings is a bit more complicated because we have no dynamic memory allocation in [no_std] environments. In order to use format strings, we use the arrayvec crate that provides fixed size arrays and strings.
✅ Add the following line to the [dependencies] section of cargo.toml:
#![allow(unused)]
fn main() {
arrayvec = {version = "0.5.2", default-features = false }
}
✅ Inside display_helper/mod.rs bring the following resources into scope:
#![allow(unused)]
fn main() {
use arrayvec::ArrayString;
use core::fmt::Write;
}
✅ Add the following function to the module.
#![allow(unused)]
fn main() {
pub fn draw_numbers (value: f32, unit: &str, position: (i32, i32), mut display: Display4in2 ) -> Display4in2 {

    // content

    display

}
}
pub fn draw_numbers takes the value of the figure, its unit, the top_left coordinate of the position where the figure is to be displayed and display as arguments. The display is returned.
The next step is to create a fixed size ArrayString as write buffer buf. The buffer is needed to store the formatted dynamic data. It needs to be able to contain at least as many characters, as the we want to display.
✅ Create the write buffer and use the write! macro to write a format string that contains the value up to 2 decimal places and the unit into the write buffer buf.
#![allow(unused)]
fn main() {
let mut buf = ArrayString::<[_; 12]>::new();

write!(&mut buf, "{:.2} {}", value, unit).expect("Failed to write to buffer");
}
Next, we use the egtext! macro to write the text into the display buffer.
✅ Add the following lines to pub fn draw_numbers:
#![allow(unused)]
fn main() {
egtext!(
    text = &buf,
    top_left = position,
    style = text_style!(
        font = Font12x16,
        text_color = BinaryColor::On,
    )
)
.draw(&mut display).unwrap();
}
✅ Go to your main program file.
✅ Right before fn main() define the following constants:
#![allow(unused)]
fn main() {
const CO2_POSITION: (i32, i32) = (220, 90);
const CO2_UNIT: &str = "ppm";

const TEMP_POSITION: (i32, i32) = (220, 130);
const TEMP_UNIT: &str = "°C";

const HUMIDITY_POSITION: (i32, i32) = (220, 170);
const HUMIDITY_UNIT: &str = "%";
}
These constants set the position, where the numbers are displayed and their unit.
✅ Inside fn main, in the measuring loop but after the values are read from the sensor, call fn draw_numbers for each figure.
#![allow(unused)]
fn main() {
let display = display_helper::draw_numbers(co2, CO2_UNIT, CO2_POSITION, display);
let display = display_helper::draw_numbers(temp, TEMP_UNIT, TEMP_POSITION, display);
let display = display_helper::draw_numbers(humidity, HUMIDITY_UNIT, HUMIDITY_POSITION, display);
}
✅ Run your program. The ePaper should display the title, numbers and their units next to the static text.
The display updates very often in a very flashy way. To reduce this, we're going to change the delay at the end of the loop. The ePaper display needs about 4 seconds for each update, so measuring more often than that is pointless.
✅ Change the delay from 2000 ms to 30000ms.
#![allow(unused)]
fn main() {
timer.delay_ms(30000_u32);
led_1.set_high().unwrap();
timer.delay_ms(30000_u32);
led_1.set_low().unwrap();
}
✅ Run your program. You should see the same output, but the screen is only updated every minute.
The display still flashes when it is updated, this and other more aesthetic issues will be addressed in the last update of this project, delivered in January.